The summer that makes the year
For a schoolwear brand, a handful of summer weeks decide the whole year. We made sure they counted.
- 20.62xReturn on Meta ad spend, July and August 2026Up from 5.68x a year earlier
- +469%Meta revenue, year on year£222,921 against £39,206
- £1.23mRevenue from Google Ads in twelve monthsA 7.17x return
The challenge
Schoolwear sells in one big rush. In the few weeks between the end of the summer term and the first day back, parents buy blazers, jumpers, trousers and PE kit in one go, and they shop around for value while they do it. For this brand, more than 70% of a year’s Google Ads revenue lands between July and September. Those few weeks carry the whole year.
So our job had two parts. Keep Google working all year as the brand’s dependable engine, and turn Meta into a serious source of sales at the peak, without the return slipping as the budget grew.
What we did
Built Meta around the way parents shop.
We organised the account by stage of decision: one campaign to introduce the brand to new families, a new retargeting campaign for 2026 to bring back parents who had already browsed, and a brand campaign for people who already knew the name.
Backed what was working.
As prospecting proved itself, we gave it more. Its spend rose by 30% on the summer before, and its return climbed from 6.76x to 19.82x. The new retargeting campaign brought back £30.77 for every £1 on its own.
Kept Google working all year round.
Shopping, Performance Max and Search work together, so the brand is there whenever a parent goes looking, whether that’s in August or in February.
The results
| Measure | 2025 | 2026 | Change |
|---|---|---|---|
| Ad spend | £6,907.95 | £10,812.41 | +56.5% |
| Purchases | 601 | 1,700 | +182.9% |
| Revenue | £39,205.81 | £222,921.48 | +468.6% |
| Return on ad spend | 5.68x | 20.62x | +263.3% |
| Cost per purchase | £11.49 | £6.36 | 44.7% lower |
| Measure | Twelve months |
|---|---|
| Ad spend | £171,733.32 |
| Revenue | £1,231,102.33 |
| Return on ad spend | 7.17x |
| Conversions | 22,341 |
July and August, a year apart
Meta revenue by month. Spend rose by 57%, and revenue rose by 469%.
- 2025
- 2026
Bar chart. July: 2025 £11,963, 2026 £59,229; August: 2025 £27,243, 2026 £163,693.
Show the numbers
| Period | 2025 | 2026 |
|---|---|---|
| July | £11,962.95 | £59,228.94 |
| August | £27,242.85 | £163,692.54 |
What every £1 brought back on Meta
Return on ad spend, July and August.
Bar chart. 2025: 5.68x; 2026: 20.62x.
Show the numbers
| Period | Return on ad spend |
|---|---|
| 2025 | 5.68x |
| 2026 | 20.62x |
In context
The typical return for apparel brands is 2.24x on Meta and 3.99x on Google (Triple Whale global medians, August 2025 to July 2026). This brand reached 20.62x on Meta at its peak, and 7.17x on Google across a full year.
What this means
Spend went up by 57%. Revenue went up by 469%. When each extra pound of budget brings back more than the pounds before it, the account is getting stronger as it grows.
Against the industry benchmark
- This brand
- Apparel median
Bar chart. Meta: This brand, July to August 2026 20.62x, Apparel median 2.24x; Google: This brand, July 2025 to June 2026 7.17x, Apparel median 3.99x.
Show the numbers
| Channel | This brand | Median |
|---|---|---|
| Meta | 20.62xThis brand, July to August 2026 | 2.24xApparel median |
| 7.17xThis brand, July 2025 to June 2026 | 3.99xApparel median |
The proof
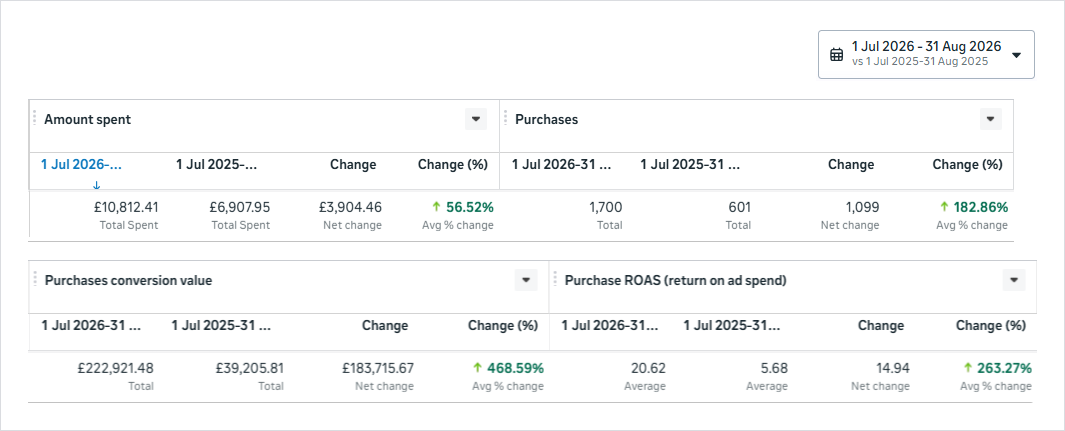 Open the full-size screenshot
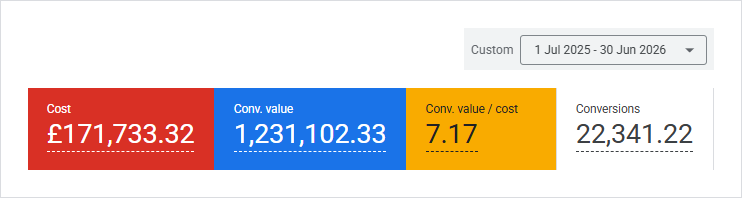 Open the full-size screenshot
What it means for you