Spending less, selling more
A young brand on a few thousand dollars a month needs every dollar to count. We found where the money was leaking and put it to work.
- +66%Revenue across Google and Meta, June to August 2026 against the same months in 2025On 8% less spend
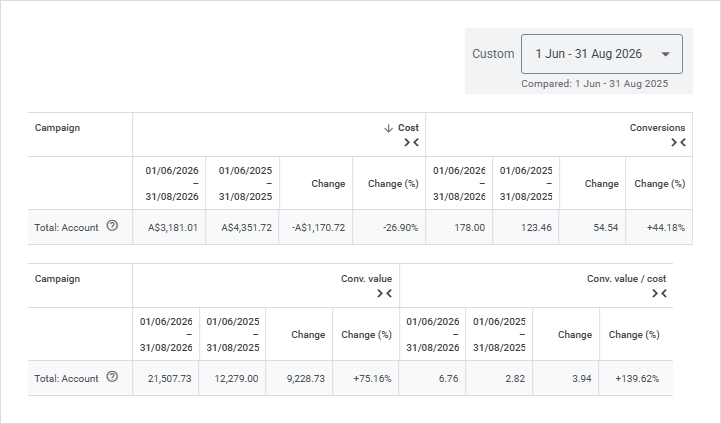
- 6.76xReturn on Google ad spendUp from 2.82x
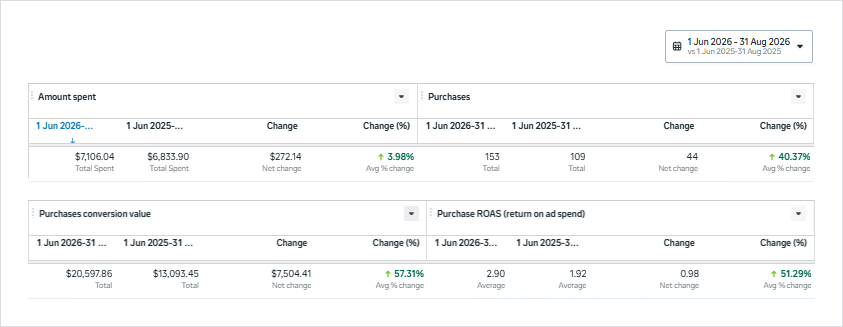
- +57%Revenue from MetaOn almost exactly the same budget
The challenge
For a young brand in a fast-moving category, every dollar spent on ads that don’t pay their way is a dollar that can’t go on stock, product or people. This brand was investing a few thousand dollars a month across Google and Meta, so every one of those dollars had to earn its place.
What we did
Followed the money.
Almost half of the previous year’s Google budget had gone to campaigns that brought back barely more than they cost, about A$1.13 for every dollar. We switched them off.
Backed what was working.
We moved the budget into the two campaigns that were already earning, brand search and Performance Max, and grew them by around 45%. Brand search improved from 5.47x to 7.52x, and Performance Max from 3.29x to 5.81x.
Rebuilt Meta with new campaigns.
We held the budget almost exactly where it was, so every gain had to come from doing things better.
The results
| Measure | 2025 | 2026 | Change |
|---|---|---|---|
| Ad spend | A$4,351.72 | A$3,181.01 | 26.9% lower |
| Conversions | 123.46 | 178.00 | +44.2% |
| Revenue | A$12,279.00 | A$21,507.73 | +75.2% |
| Return on ad spend | 2.82x | 6.76x | +139.6% |
| Cost per conversion | A$35.25 | A$17.87 | 49.3% lower |
| Measure | 2025 | 2026 | Change |
|---|---|---|---|
| Ad spend | A$6,833.90 | A$7,106.04 | +4.0% |
| Purchases | 109 | 153 | +40.4% |
| Revenue | A$13,093.45 | A$20,597.86 | +57.3% |
| Return on ad spend | 1.92x | 2.90x | +51.3% |
| Cost per purchase | A$62.70 | A$46.44 | 25.9% lower |
| Measure | 2025 | 2026 | Change |
|---|---|---|---|
| Ad spend | A$11,185.62 | A$10,287.05 | 8.0% lower |
| Revenue | A$25,372.45 | A$42,105.59 | +66.0% |
| Blended return | 2.27x | 4.09x | +80.4% |
Where the Google budget went
June to August. In 2025, almost half the budget sat in campaigns returning A$1.13 per dollar. In 2026, all of it went to the campaigns that worked.
- Campaigns we kept and grew
- Campaigns we switched off
Bar chart. 2025: campaigns we kept and grew A$2,182 at 4.50x, campaigns we switched off A$2,169 at 1.13x; 2026: campaigns we kept and grew A$3,181 at 6.76x.
Show the numbers
| Campaigns | Year | Spend | Revenue | Return |
|---|---|---|---|---|
| Campaigns we kept and grew | 2025 | A$2,182.47 | A$9,824.03 | 4.50x |
| Campaigns we kept and grew | 2026 | A$3,181.01 | A$21,507.73 | 6.76x |
| Campaigns we switched off | 2025 | A$2,169.25 | A$2,454.97 | 1.13x |
| Campaigns we switched off | 2026 | A$0.00 | A$0.00 | No spend |
Less in, more out
Ad spend and revenue across Google and Meta, June to August.
- Ad spend
- Revenue
Bar chart. 2025: Ad spend A$11,186, Revenue A$25,372; 2026: Ad spend A$10,287, Revenue A$42,106.
Show the numbers
| Period | Ad spend | Revenue |
|---|---|---|
| 2025 | A$11,185.62 | A$25,372.45 |
| 2026 | A$10,287.05 | A$42,105.59 |
In context
The typical return for health and wellness brands is 1.44x on Meta and 2.06x on Google (Triple Whale global medians, August 2025 to July 2026). This brand reached 2.90x on Meta and 6.76x on Google.
What this means
Every gain here came from the budget the brand already had. We found the money that was being wasted and moved it somewhere it could work.
Against the industry benchmark
- This brand
- Health and wellness median
Bar chart. Meta: This brand, June to August 2026 2.90x, Health and wellness median 1.44x; Google: This brand, June to August 2026 6.76x, Health and wellness median 2.06x.
Show the numbers
| Channel | This brand | Median |
|---|---|---|
| Meta | 2.90xThis brand, June to August 2026 | 1.44xHealth and wellness median |
| 6.76xThis brand, June to August 2026 | 2.06xHealth and wellness median |
The proof
 Open the full-size screenshot
 Open the full-size screenshot
What it means for you